Berana-viz: A Data Structures and Algorithms Visualization Web App


Our ability to make sense of complex information like algorithms is greatly enhanced by data visualization. Combining graphs, charts, and other visuals with animation allows us to convey concepts in a more intuitive and understandable manner.
There are countless ways we could implement visualization software, but in this article, I discuss how you go about making a visualization web app using two popular technologies; ReactJs and D3.js.
Note that this is not a ReactJS or D3.js tutorial, rather it explains how you would integrate them to build a visualization web app.
Planning and UI Design
Now before diving deep into the inner working of this web app, let's define its scope. The web app should be able to show data as a bar chart and a complete binary tree, these will be our data structures. Furthermore, it should allow the user to run sorting and searching algorithms and display each step frame by frame or play an animation. As a bonus, the app should allow the user to save documents (which are the sets of nodes created by the user).
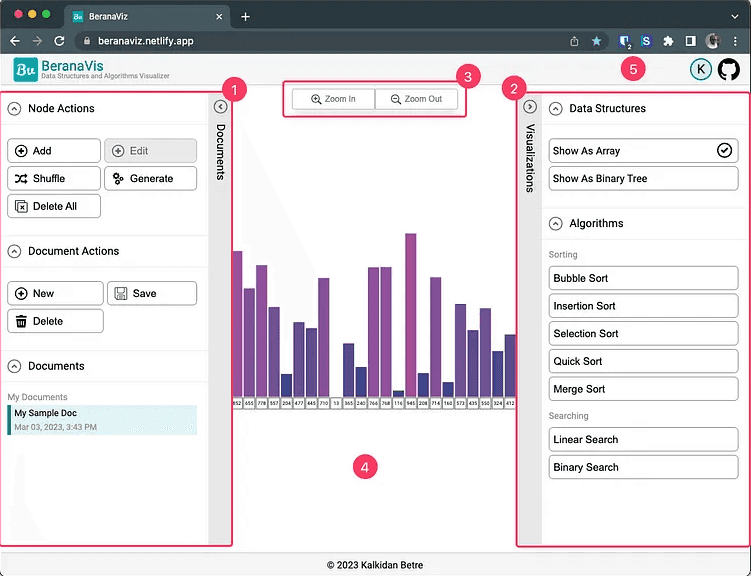
The overall design of the web app will look like the picture below. It constitutes 5 main sections (excluding the footer).
- Node and Document actions sidebar for management of data
- Visualization Sidebar to choose data structures and algorithms
- A floating Zoom controllers component
- Main drawing canvas
- An app bar with a user avatar (signup, login, and logout) and link to the repo
Frontend Architecture
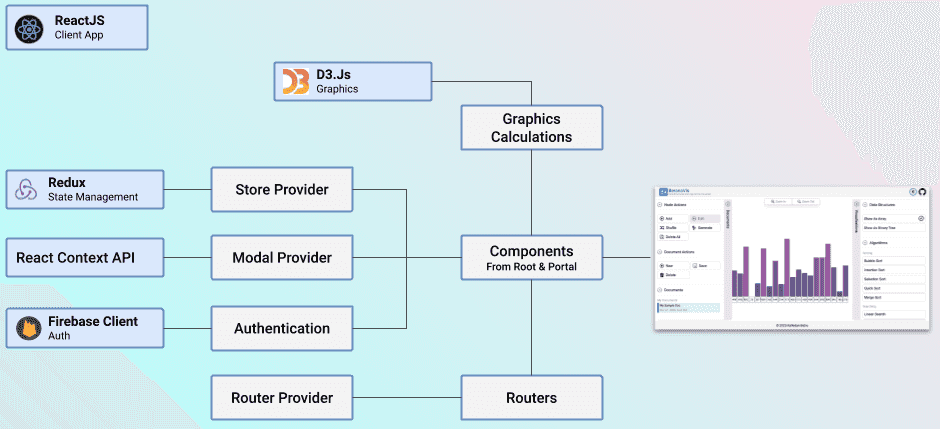
In order to implement this app, as you can see we require several components to work together. This design decision could be made in a different manner. For instance, D3.js can handle ui rendering without requiring ReactJs, I just decided to use this pattering to let ReactJs be responsible for all UI-related tasks. Furthermore, I have used Firebase for authentication but this is optional as it is only required to authenticate the user for the purpose of document management (saving and retrieving documents to our backend database).
State Management
As the data being used by the web app needs to be modified and accessed from various parts of the app, we need to manage the global state. I could have gone with several options, but for this case, I choose to use Redux, which is a popular state management library that works well with ReactJs. And at the time of writing, Redux-toolkit is the officially recommended way of implementing Redux state so I have used it for this app.
For the global state, we need to track three states:
- Nodes: this is the main source of data for the canvas to use for visualization
- Canvas state: the state will tell us what type of data structure is being displayed and whether an animation is being run on the canvas
- Document: we will use this to store the selected document (out of the documents saved by the user) and also if the document is a sample document provided by the app (as a default)
export const store = configureStore({
  reducer: {
    nodes: arrayReducer,
    canvas: canvasReducer,
    document: documentReducer,
    [beranavizApi.reducerPath]: beranavizApi.reducer,
  },
  middleware: (getDefaultMiddleware) =>
    getDefaultMiddleware().concat(beranavizApi.middleware),
});

setupListeners(store.dispatch);

export type RootState = ReturnType<typeof store.getState>;
export type AppDispatch = typeof store.dispatch;

export const { selectById: selectNodeById, selectAll: selectAllNodes } =
  nodesAdapter.getSelectors((state: RootState) => state.nodes);

type DispatchFunc = () => AppDispatch;
export const useAppDispatch: DispatchFunc = useDispatch;
export const useAppSelector: TypedUseSelectorHook<RootState> = useSelector;
Graphics Calculations
The relationship between D3.js and ReactJs will be clearly set as shown on the flow chart below. D3.js will handle the graphical calculations and ReactJs will handle the rending of svg components on the DOM.
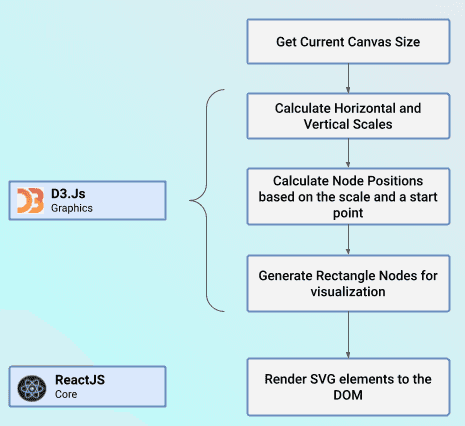
As shown above, D3.js will start by first receiving the current canvas size and calculating the horizontal and vertical scales. For the horizontal scales, I will be using the scaleBand method and for the verticals, I will use the scaleLinear method. I have also added color scales with the help of chroma-js. So putting it all together in a draw function which is wrapped in a useCallback hook for performance. In the code snippet below, I have removed part of the code to show only the part concerning D3.js
const ArrayGraphic = (props: ArrayGraphicProps) => {
    let nodes: Node[] = useAppSelector(selectAllNodes);
    const [bars, setBars] = useState<Bar[]>([]);
    ....

    const draw = useCallback(
        () => (nodes: Node[]) => {
            const rect = canvasRef.current?.getBoundingClientRect();
            const midPoint = {
                x: rect ? rect.width / 2 : 0,
                y: rect ? rect.height / 2 : 0,
            };
            const { low, mid, high } = CHART_COLOR_RANGE;

            const colors = chroma.scale([low, mid, high]).mode('hsl');
            const xScale = d3
                .scaleBand()
                .range([0, nodes.length * NODE_RECT.width])
                .padding(0.1);
            const yScale = d3
                .scaleLinear()
                .range([
                    (rect ? rect?.height : 0) - props.margin,
                    props.margin,
                ]);
            const colorScale = d3.scaleLinear();

            xScale.domain(nodes.map((node) => node.id));

            const values = nodes.map((node) => node.value);
            yScale.domain([0, Math.max(...values)]);
            colorScale.domain([Math.min(...values), Math.max(...values)]);

            const stPtX =
                midPoint.x - (nodes.length * 1.05 * NODE_RECT.width) / 2;
            const newBars = nodes.map((node: Node, i: number) => {
                let xPt = stPtX + (xScale(node.id) || 0);
                let yPt = yScale(node.value);

                return {
                    id: node.id,
                    value: node.value,
                    status: node.status,
                    x: xPt,
                    y: yPt,
                    width: xScale.bandwidth(),
                    height: yScale(0) - yPt,
                    color: colors(colorScale(node.value)),
                };
            });

            setBars(newBars);
            d3.select(canvasRef.current).call(zoomHandler());
        },
        [zoomHandler, props.margin]
    );

    ...

    useEffect(() => {
        draw()(nodes);
        ...
    }, [...]);

    return (
        ...
    );
};
Rendering to the DOM
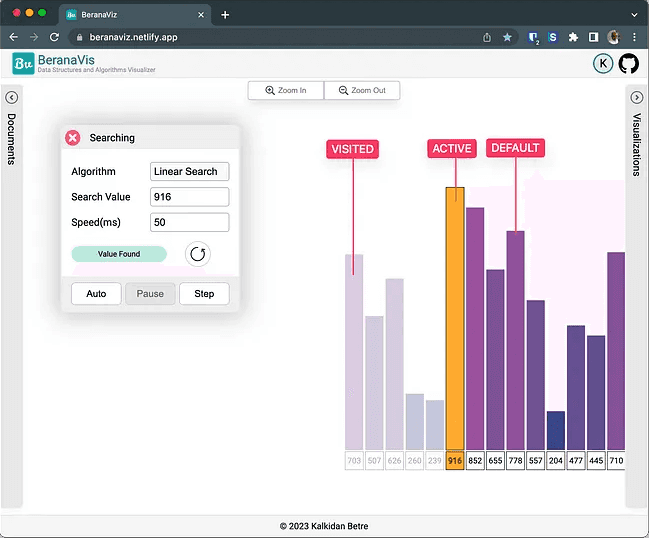
Taking the calculated values from D3.js, React will then create the necessary svg elements and render them to the DOM. For this, I will use rect and text elements. Fro simplicity will only show part of the implementation. If you look closely, I assign different classes based on the status of the node (ACTIVE and VISITED). This will be really helpful for animation (discussed below) and also for visual change when the user selects a node.
const ArrayGraphic = (props: ArrayGraphicProps) => {
    ....
    const [bars, setBars] = useState<Bar[]>([]);
    ...

    return (
        <div className={styles.graphicContent}>
            ...
            <svg ref={canvasRef} className={styles.canvas}>
                <g ref={svgContentRef}>
                    {bars.map((bar) => {
                        const classes = [];
                        if (bar.id === selectedNodeId)
                            classes.push(styles.active);
                        else {
                            if (bar.status === NodeStatus.ACTIVE)
                                classes.push(styles.active);
                            else if (bar.status === NodeStatus.VISITED)
                                classes.push(styles.visited);
                        }
                        return (
                            <g
                                key={bar.id}
                                onClick={() => handleNodeClick(bar.id)}
                            >
                                <rect
                                    className={classes.join(' ')}
                                    key={`rect-bs-${bar.id}`}
                                    x={bar.x}
                                    y={bar.y + bar.height - NODE_RECT.height}
                                    width={bar.width}
                                    height={bar.width}
                                    fill={'none'}
                                    stroke="black"
                                    strokeWidth="1px"
                                />

                                ...
                            </g>
                        );
                    })}
                </g>
            </svg>
        </div>
    );
}
Creating Animation Frames
As shown above, running animation means changing the status of the nodes and thereby changing the look of the nodes being rendered. Hence, to render each frame of the animation, we just have to find a way to change the node status based on the algorithm being run and pass it to the canvas for rendering.
No the problem we have to solve is to be able to render a step in an algorithm without finishing all the steps. The other option will be to generate all the frames beforehand and display them one by one. But this would be really inefficient b.c the user might cancel the animation or the user might just want to step through the first few frames. Hence, calculating all the frames ahead would not be a good choice.
Say hello to Generators ...
Generators are functions that can be exited and later re-entered. Their context (variable bindings) will be saved across re-entrances. (straight from MDN)
Hence, they are the perfect solution to our problem. In each call we generate a frame and render it, if more frame is required, well… we generate more. Here is an implementation for the insertion sort algorithm
export default function* insertionSortIterator(nodes: Node[]): AlgoGenerator {
  const values = nodes.map((node) => node.value);
  let i = 1;
  while (i < values.length) {
    let j = i;
    yield { selectedId: nodes[i].id, updates: [] };
    while (j >= 0 && values[j - 1] > values[j]) {
      let updates: Update<Node>[] = [
        {
          id: nodes[j].id,
          changes: { value: values[j - 1] },
        },
        {
          id: nodes[j - 1].id,
          changes: { value: values[j] },
        },
      ];
      [values[j], values[j - 1]] = [values[j - 1], values[j]];
      yield { selectedId: nodes[j - 1].id, updates };
      j--;
    }
    i++;
  }
}
where AlgoGenerator is a custom type that I created to track changes in the state of the frames.
type AlgoGenerator = Generator<{
  selectedId: string;
  updates: Update<Node>[];
  found?: boolean;
}>;

export default AlgoGenerator;
Running Animations.
To run the animations we will make use of requestAnimationFrame with setTimeout defined with a time specified by the user. Combing this two will look like the following.
Note the iterator in the code below, this is the Generator we created above (whose return value is an iterator that we are going to use). So as long as the iterator is not “done” we go through the frames. Here, the onSubmit handler will run the animation in Auto mode and well the onStep method speaks for itself.
interface SortingModalProps {
    onClose?: () => void;
    algo: SortingAlgo;
    iterator: AlgoGenerator | null;
}

const SortingModal = (props: SortingModalProps) => {
    ...
    const animRunning = useRef<boolean>(false);
    ...

    const onSubmit = async (data: any) => {
        setDisableClose(true);
        animRunning.current = true;
        startAnimation(data.animTime);
    };

    const startAnimation = (delay: number) => {
        function playAnimation() {
            runStep();
            if (animRunning.current)
                setTimeout(() => requestAnimationFrame(playAnimation), delay);
        }
        requestAnimationFrame(playAnimation);
    };

    const stopAnimation = () => {
        animRunning.current = false;
        setDisableClose(false);
    };

    const onStep = (e: React.MouseEvent) => {
        e.preventDefault();
        runStep();
    };

    const runStep = () => {
        if (props.iterator) {
            let result = props.iterator.next();
            if (result.done) {
                stopAnimation();
            } else if (result.value) {
                if (result.value.updates.length > 0)
                    dispatch(nodesUpdated(result.value.updates));
                dispatch(nodeSelected(result.value.selectedId));
            }
        }
    };

    return (
        ...
    );
};
The Backend
If you want to save your document you need a backend. This can be implemented in any way you like. Such as Firebase, Express, Flask, FastAPI, Django … you name it. In my case, I used Django with the Django REST Framework plus MySQL database.
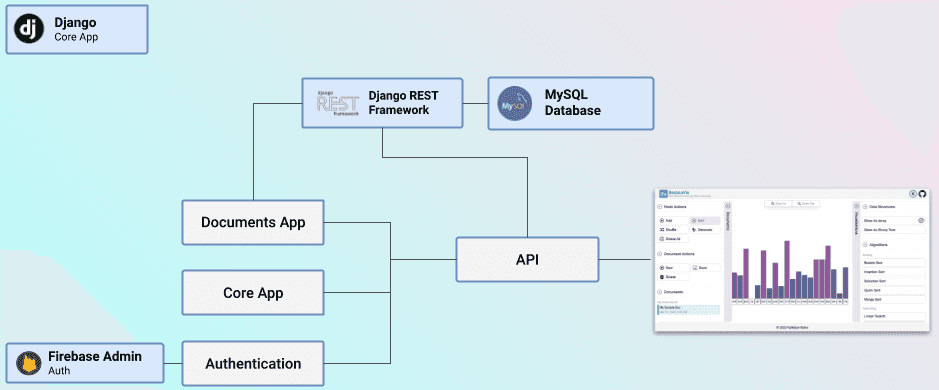
As it is shown in the above diagram, I used two main apps. One for Core app implementation and the other for Document management. For authentication, I used Firebase Admin. The client will send the firebase issued access token and I will verify this using Firebase Admin before allowing CRUD operations.
Conclusion
Though it is impossible to discuss every feature of the web app in a single blog, I hope I managed to cover the important parts. I learned a lot in building this app, it was a great pleasure writing about it.
Data visualization is an interesting subject and has a lot of impact on both learning and making important decisions. This simple implementation can be converted into a very complex and interesting app but for its purpose, I believe it will do for now.
Open Source
This project is open source and can be found on